1 Identifying trends:
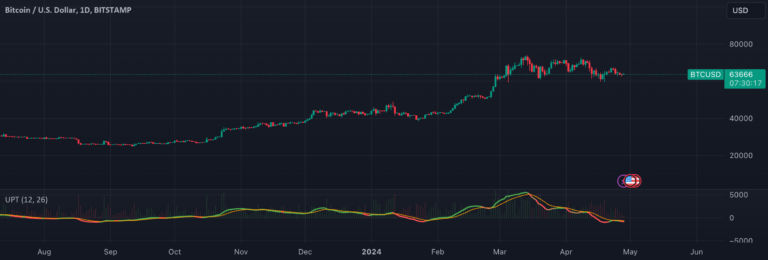
• This indicator is primarily intended to identify market trends. This is done by calculating two EMAs (fast and slow) and deriving the MACD line, which is the difference between these two EMAs. The MACD line is a momentum indicator that shows the relationship between two moving averages. When the MACD line is above the signal line, it indicates bullish momentum, and when it is below it indicates bearish momentum.
2 Entry and exit signals:
• This indicator generates potential entry and exit signals based on several conditions.
• Price vs. 20-period EMA: Checks whether the price is above or below the 20-period exponential moving average. This is a common technique used to determine the overall direction of a trend. If the price is above the 20-period EMA, it indicates a bullish trend, while below it indicates a bearish trend.
• MACD Slope: Calculates the slope of the MACD line over the specified number of bars. A positive slope indicates increasing bullish momentum, and a negative slope indicates increasing bearish momentum.
• Signal line crossover: Traders often look for crossovers between the MACD line and the signal line as a potential buy or sell signal. When the MACD line crosses above the signal line, it is considered a bullish signal (buy), and when it crosses below it, it is considered a bearish signal (sell).
3 Visual representation:
• This indicator provides a visual representation of market conditions (bullish, bearish, or neutral) by plotting the MACD line in different colors depending on these conditions. Additionally, we draw a vertical line at the beginning of a negative slope in the MACD to highlight potential changes in momentum.
4 Volume analysis:
• Incorporates volume analysis by coloring the volume histogram with different colors based on whether the price is above or below the 20-period EMA. This provides further confirmation of the strength of the trend. Increasing volume when price moves above the EMA can support a bullish trend, while increasing volume when price moves below the EMA can support a bearish trend.
5 Customization:
• Traders can customize input parameters such as fast and slow EMA periods depending on their trading strategy and the specific market they are analyzing.
In the true spirit of TradingView, the authors of this script have made it open source so traders can understand and verify it. Cheers to the author! Although it is free to use, reuse of this code in publications is regulated by house rules. You can add it to your favorites and use it on the chart.
The information and publications are not intended to be and do not constitute financial, investment, trading or other types of advice or recommendations provided or endorsed by TradingView. Please read our Terms of Use for more details.
Want to use this script in your charts?

