

Accuracy evaluation
Table 2 shows the fitting equation results between the total nighttime light value and CO2 emissions in the CCEZ from 2000 to 2020. The R2 of the fitting equation is more than 80%, indicating a good fitting effect and valid results. To ensure the reliability of the estimated carbon emissions in the CCEZ, they are compared with the corresponding actual carbon emissions. The root mean square error (RMSE) and mean relative error (MRE) between the estimated values and the actual values from 2000 to 2020 are shown in Table 2. Table 3 shows that the RMSE ranges from 23.99 to 77.80 thousand tons, and the MRE of most years ranges from 3.73 to 10%, with no errors exceeding 15% for all years. Nighttime light data have good estimation accuracy for CO2 emissions and can be used to study the spatial and temporal evolution characteristics of CO2 emissions in the CCEZ.
Qualitative analysis
Provincial scale
Overall, carbon emissions in the CCEZ continued to increase from 2000 to 2020, an increase of 2.5 times. Chengdu and Chongqing have the highest carbon emissions in the CCEZ. Over the 21-year period at the provincial scale, the carbon emissions in Sichuan Province increased from 101.94 million tons in 2000 to 258.58 million tons in 2020, an increase of more than 2.53 times. Chongqing increased from 68.63 million tons to 147.89 million tons, an increase of 2.15 times. Figure 3 shows the CO2 emissions in Sichuan Province and Chongqing from 2000 to 2020. The total carbon emissions in Sichuan Province and Chongqing Municipality increased rapidly from 2000 to 2006, with average annual growth rates of 11.99% and 4.95%, respectively. From 2006 to 2014, they showed a steady upward trend, with average annual growth rates of 3.59% and 2.32%, respectively. From 2014 to 2020, they showed a fluctuating and slow upward trend.
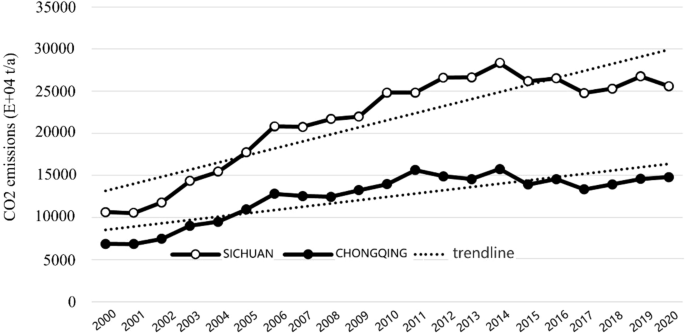
CO2 emissions in the CCEZ from 2000 to 2020.
Municipal scale
As shown in Figure. Figure 4 shows that the carbon emissions of Chengdu and Chongqing are significantly greater than those of other cities. With the passage of time, the number of lower and higher carbon emission areas in the Chengdu–Chongqing economic circle increases, and the higher carbon emission areas expand to the north. The lower carbon emission area tends to expand to the south.

Characteristics of carbon emission evolution at the city level.
In 2000, high carbon emission areas were distributed in Chengdu and Chongqing, higher carbon emission areas were distributed in Deyang city, and low carbon emission areas and lower carbon emission areas accounted for a large proportion. The overall carbon emissions show a pattern of more in the northeast and less in the southwest; from 2000 to 2006, high carbon emission areas and higher carbon emission areas increased. High carbon emission areas increased in Mianyang city, and higher carbon emission areas increased in Deyang city and Nanchong city. This may be due to the formal launch of regional planning in 2006, and put forward: “in the next 5 to 10 years, it is necessary to actively build the largest dual-core urban agglomeration in western China, with Chengdu and Chongqing as the center and central cities at all levels connecting and cooperating with each other”. This is the first time that the concept of the Chengdu–Chongqing economic zone has appeared in the report at the national level, and the cities have developed rapidly under the promotion of relevant policies. From 2006 to 2008, first, there was a reduction in total carbon emissions. It may be that the Wenchuan earthquake occurred in that year, which affected the economic development of the city in the Chengdu–Chongqing economic circle and reduced carbon emissions. Second, in terms of the regional distribution of high and low carbon emissions, the high carbon emission area and the higher carbon emission area remain unchanged, while the lower carbon emission area shows an expansion trend on the original basis, increasing Yibin and Guang’an. This may be due to the industrial restructuring and upgrading of the Guang’an and Yibin cities, which have transformed from traditional manufacturing with high energy consumption and high emissions to low-energy and low-emission industries such as high-end manufacturing and modern services, thus reducing carbon emissions. From 2008 to 2014, low-carbon emission areas continued to increase, increasing in Suining city. From 2014 to 2020, the growth trend of overall carbon emissions in the Chengdu–Chongqing economic circle was stable, the high carbon emission area and the higher carbon emission area remained unchanged, and the medium carbon emission zone increased in Guang’an, Suining and Yibin. In addition, Ya’an city and Leshan city are rich in forest resources, forest coverage is more than 50%, the proportion of secondary industry is small, and carbon emissions are low.
County scale
At the county scale, based on the estimation results of carbon emissions, the carbon emissions of county-level administrative regions in the CCEZ are obtained through zoning statistics. Figure 5 shows the county-level carbon emissions in the CCEZ from 2000 to 2020. In terms of total carbon emissions, counties with high carbon emissions account for 1% to 6%, and these counties are mainly distributed in the Shuangliu District and Wuhou District of Chengdu, Yubei District and Tongliang district of Chongqing, etc.. Low carbon emission areas are concentrated in the peripheral cities of the Chengdu–Chongqing urban agglomeration and cities with lower industrialization levels around the Sichuan Basin, with low carbon emission counties accounting for 21% to 41%.

Evolutionary characteristics of carbon emissions at the county level.
In terms of spatial structure, initially, a multicenter-periphery structure was observed. Several centers were distributed in the western, eastern, and northern parts of the CCEZ, with higher carbon emissions in the central counties and lower carbon emissions in the surrounding areas. This means that initially, the carbon emissions in the eastern, western, and northern regions were higher, while the central and southern regions had relatively lower carbon emissions. Over time, the high carbon emission areas in the northern part decreased, and a dual-core-periphery spatial structure with higher carbon emissions in the eastern and western core areas and lower carbon emissions in the surrounding areas began to form.
In terms of changes in the regions with high and low carbon emissions, in 2000, the counties with high carbon emissions were mainly distributed in Wuhou District, Jinjiang District, Shuangliu District of Chengdu, Fucheng District and Jiangyou of Mianyang, Jingyang District of Deyang, Yubei District, Shapingba District, and Banan District of Chongqing. The counties with relatively high carbon emissions were mainly concentrated in Chenghua District, Xindu District, Pixian District of Chengdu, Youxian District of Mianyang, Yongchuan District, Jiangjin District, and Hechuan District of Chongqing. In 2003, the carbon emissions in most counties within the CCEZ increased, and the counties with high carbon emissions added to Xindu District, Qingbaijiang, Chenghua District, and Longquanyi District of Chengdu. The counties with relatively high carbon emissions included the Chuanshan District of Suining, Guang’an District of Guang’an, Dazu District, and Dianjiang County of Chongqing. In 2006, carbon emissions showed a stable growth trend and began to change from a multicenter to a dual-core pattern. The main manifestation was that the distribution of carbon emissions expanded from the core areas of Jinjiang District and Shuangliu District of Chengdu and Yubei District of Chongqing. In 2014, carbon emissions showed a significant growth trend, mainly manifested by the expansion of the region with medium carbon emissions in the central part of the CCEZ. In 2017, due to the implementation of carbon emission reduction policies, the distribution of carbon emissions in the region decreased, which was mainly reflected in the reduction in the number of counties with high carbon emissions and relatively high carbon emissions in the central region. In 2020, the total carbon emissions continued to increase steadily, while those of the counties with high carbon emissions and relatively high carbon emissions remained unchanged. Overall, the main urban areas of Chengdu and Chongqing have large total carbon emissions, but the growth rate tends to be stable, while the surrounding counties, driven by their development, have a faster growth rate of carbon emissions.
Grid scale
Figure 6 shows the spatial distribution of carbon emissions at a 1 km × 1 km resolution from 2000 to 2020, obtained through estimation and inversion at the county scale. At the grid scale, the high carbon emission areas in the CCEZ from 2000 to 2020 exhibit a multicore distribution pattern, evolving into two main cores in Chengdu and Chongqing, gradually expanding radially outward, and ultimately forming a connected pattern of high carbon emission core areas. Through macroscopic analysis of the overall layout and municipal-scale positioning of the CCEZ, as well as analysis of carbon emission distribution at the county and grid levels, it was found that there are certain differences within the economic zone. Describing this phenomenon at multiple scales can provide an effective reference for precise emission reduction positioning.

Evolutionary characteristics of carbon emissions at the grid scale.
Quantitative analysis
Distribution direction and gravity center migration
Figure 7 shows the results of carbon emissions analysis at the grid scale from 2000 to 2020. We found that the center of gravity of carbon emissions in the CCEZ moved northwestward from 2011 to 2016 and then started to move southeastward from 2016, shifting from a direction closer to Chengdu to a direction closer to Chongqing.
Combined with the data on the proportion of secondary industry in the regional GDP, from 2011 to 2016, the regional GDP of Chongqing increased from 55,462,990 to 78,945,626 CNY, representing a growth rate of approximately 1.42 times. The regional GDP of Chengdu increased from 31,462,516 to 52,332,004 yuan, representing a growth rate of approximately 1.66 times. The growth rate of the secondary industry’s GDP in Chengdu exceeded that in Chongqing, which is consistent with the conclusion that the center of carbon emissions shifted from Chongqing to Chengdu from 2011 to 2016. From 2016 to 2020, the regional GDP of Chongqing increased from 78,945,626 to 99,911,988 yuan, a growth rate of approximately 1.27 times. The regional GDP of Chengdu increased from 52,332,004 to 54,196,303 yuan, representing a growth rate of approximately 1.04 times. The growth rate of the secondary industry’s GDP in Chongqing exceeded that in Chengdu, which is consistent with the conclusion that the center of carbon emissions shifted from Chengdu to Chongqing after 2016 (Fig. 7).

Direction of carbon emission center of gravity migration.
In addition, high carbon emission areas have expanded outward from the two core cities, with the areas surrounding Chengdu showing the most significant high carbon emission. The carbon emissions in the cities adjacent to Chengdu and the central area of Chongqing increased significantly.
Spatial autocorrelation analysis
Figure 8 shows the results of the spatial correlation measurements of carbon emissions at different scales in the CCEZ using the global Moran’s I index and corresponding z values. At the municipal scale, the global Moran’s I index for the CCEZ from 2000 to 2020 is positive, indicating the presence of spatial autocorrelation, but the autocorrelation may not be very strong. For example, in 2020, the z score is 0.688135, and in 2020, the z score is 0.707981, indicating some statistical significance. However, the p values are 0.491368 and 0.478957, respectively, indicating that the results are not statistically significant. The municipal-scale analysis is conducted on a larger spatial scale, focusing on the average situation of municipal-scale administrative units. At this scale, the spatial autocorrelation of carbon emissions in the CCEZ is weak. This may be due to differences in industrial structure, energy structure, population distribution, and other factors among different cities. These factors may affect the spatial distribution and correlation of carbon emissions.

Multiscale spatial autocorrelation analysis.
At the county and grid scales, the global Moran’s I index of the CCEZ from 2000 to 2020 is positive and close to 1, indicating a strong positive spatial correlation in carbon emissions. This may be due to the close economic and geographical connections between cities in the Chengdu-Chongqing region, resulting in similar distribution patterns of carbon emissions. The z scores are much greater than the critical value of 1.96 for a standard normal distribution, indicating that this spatial autocorrelation is statistically significant at a level of 0.05 and not the result of random variation. The p values are all less than 0.05, indicating that this spatial autocorrelation is highly significant and credible.
Second, in terms of the changes in the global Moran’s I index from 2000 to 2020, the index shows an overall increasing trend over time. During the period from 2000 to 2021, the global Moran’s I value at the county level increased from 0.3471 to 0.4643, and the global Moran’s I value at the grid level increased from 0.9594 to 0.9638. This indicates that the spatial correlation of carbon emissions in the CCEZ is strengthened. At the county scale, carbon emissions show an agglomeration state, and the same applies at the grid scale, meaning that counties with higher carbon emissions are also surrounded by other counties with higher carbon emissions.
Analysis at the county and grid scales is conducted within a smaller spatial range, which can capture more detailed spatial information. At these two scales, there is a strong spatial autocorrelation in carbon emissions in the CCEZ, possibly due to significant geographical, economic, and climatic connections between counties in the region. In addition, spatial autocorrelation analysis alone cannot reveal the clustering status of carbon emissions at the county scale within the CCEZ. Therefore, further clustering is needed to explore the variations in carbon emissions at the county scale and discover the underlying patterns, providing theoretical references for the formulation of precise emission reduction policies.
Hotspot analysis
Due to the significant autocorrelation relationship at the county and grid scales in the CCEZ, further hotspot analysis was conducted on carbon emissions. At the county scale, the distribution of carbon emission hotspots showed a significant dual-core outward diffusion trend, and the results are shown in Fig. 9. In terms of the distribution of carbon emission hotspots in the CCEZ, significant spatiotemporal differences were observed. The major hotspots were concentrated in Chenghua District and Pixian District of Chengdu city, Yubei District, Shapingba District, and Nan’an District of Chongqing city, indicating that these counties had high carbon emissions and exhibited an agglomeration state. The hotspots and subhotspots were located adjacent to the extreme hotspot areas distributed in Longquanyi District, Jintang District, Dayi County of Chengdu, and Huaying city of Chongqing, indicating the radiation effect of counties with high carbon emissions on their surrounding areas. The coldspots and subcoldspots were distributed in the peripheral cities of the Chengdu-Chongqing urban agglomeration and in cities with lower industrialization levels around the Sichuan Basin. The coldspot areas were mainly concentrated in Ya’an, Leshan, Yibin, and Nanchong, while the hotspot areas were concentrated in Chengdu, Deyang, and the main urban area of Chongqing, forming patchy extreme hotspot areas.

Analysis of hotspots at the county level.
At the grid scale, in 2000, the distribution of hotspots showed a scattered structure, with Chengdu and Chongqing being the main urban areas at the core. In 2013, the hotspot area structure changed, forming a belt radiating outward with Chengdu and Chongqing’s main urban areas as the core. In 2020, the hotspot area of carbon emissions continued to expand around the core area, and the results are shown in Fig. 10.

Grid-scale hotspot analysis.
In conclusion, the spatial distribution of carbon emissions in the CCEZ is uneven. Chengdu and Chongqing’s main urban areas have large total carbon emissions, but the growth rate tends to be stable. The surrounding counties of Chengdu and Chongqing, driven by their development, have a faster growth rate of carbon emissions.
Lisa cluster analysis
By using LISA clustering, the local spatial characteristics of carbon emissions at the county scale in the CCEZ are displayed. At the county scale, the distributions of counties with strong spatial autocorrelation from 2000 to 2020 are similar, and the results are shown in Fig. 11.

County-scale LISA clustering.
In 2000, there were 52 counties classified as LL-type, mainly distributed in cities such as Ya’an, Leshan, and Nanchong. There were 35 counties classified as HH-type, which were mainly distributed in most counties of Chengdu, Deyang, and Chongqing. Other counties were not significant regions. In 2006, there were 45 counties classified as LL-type, with decreases mainly in the northern region, including Dongxing District and Longchang in Neijiang, Anju District and Daying County in Suining, Tongchuan District, Dachuan District, and Qu County in Dazhou. The HH-type counties increased in Jintang County and Jianyang in Chengdu. The clustering areas in 2013 were similar to those in 2006, with a decrease in the number of LL-type counties in Yingshan County, Dazhou. The HH-type counties increased with Anzhou District in Mianyang. In 2020, the LL-type counties overlapped with those in 2013, and the HH-type counties decreased in Chongzhou District and Shuangliu District in Chengdu and Yongchuan District in Chongqing. Overall, the county-scale carbon emissions in the CCEZ show obvious clustering characteristics, and Chengdu, Deyang, and the municipal districts of Chongqing, which belong to the HH-type cluster, can be identified as precise emission reduction areas.
Carbon emission trend analysis
First, the carbon emission data at the grid scale for the years 2000–2020, for a total of 21 years, were transformed into panel data files. The files were then filtered to extract valid data and merged. Next, Sen’s slope algorithm was used to calculate the trend in carbon emissions for each grid from 2000 to 2020. The trend values were subjected to significance testing using the Mann‒Kendall trend test. A p value less than 0.05 indicated a reliable trend. After confirming the reliability of the calculation results, the trend calculation results were connected to the vector fishnet file, and the visualization results were finally output.
Figure 12 shows the visualization results of the trend analysis. The carbon emissions in the CCEZ from 2000 to 2020 experienced an overall upward trend with stable changes. From the perspective of the internal regions, the areas with significant carbon emission changes are mainly concentrated in the northwestern and southeastern central regions. The trend in carbon emissions in the northwest region is generally greater than 0, indicating an upward trend in carbon emissions, while the trend in carbon emissions in the southeast central region is less than 0, indicating a significant downward trend. The Mann‒Kendall trend test also revealed the magnitude of carbon emission changes in the CCEZ, revealing that the overall change from 2000 to 2020 was relatively small and the results are shown in Fig. 13.

Trend of carbon emissions.

Magnitude of carbon emission changes.