(MENAFN-Daily Forex) Bearish View
Sell the BTC/USD pair and set a take profit at 53,000.
Add a stop loss at 59,000.
Timeline: 1-2 days.
Bullish view
Set your buy stop at 57,000 and take profit at 60,000.
Add a stop loss at 55,000.
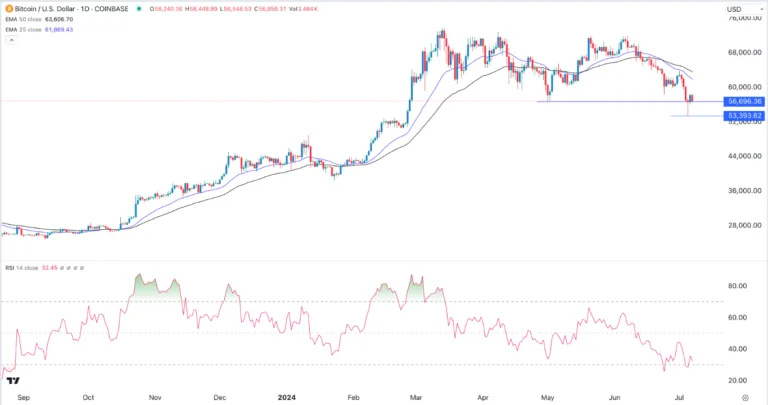
Bitcoin prices stabilized over the weekend after a strong sell-off last Friday. After dropping to 53,393, the BTC/USD pair rebounded to above 58,000 on Saturday. It traded at 57,000 on Monday as traders waited for the next catalyst pullback to weaken. Bitcoin has faced many headwinds over the past few weeks and has been under strong pressure. First, there is the fact that there has been no major news for Bitcoin in the past few months. The Securities and Exchange Commission (SEC) already approved 11 ETFs earlier this year, even though the halving event happened a few months ago. Second, there are signs that wallets associated with Mt. Gox have started to move funds, meaning that billions of dollars worth of Bitcoin could be liquidated in the coming months, increasing supply. Third, the German government has started to move Bitcoin in its portfolio on exchanges, a sign that it will soon start selling Bitcoin. Top FX Brokers
1 Get Started 74% of retail CFD accounts lose money
Additionally, many Bitcoin mining companies have capitulated and started selling their Bitcoin holdings. All these events have led to an increase in Bitcoin balances on exchanges, which is a negative sign for the coin. On the positive side, following last week’s US employment and PMI figures, the Federal Reserve may start lowering interest rates later this year. A rate cut by the Fed would be positive for Bitcoin and other risk assets. Another positive is that Joe Biden has pledged to remain in the US presidential race. This is a positive sign as it increases the chances of Donald Trump winning the presidential election in November. Most crypto traders look favorably on Trump in terms of technical analysis for the Reg/USD pair. The BTC/USD pair has formed a huge double top pattern around the 72,000 level in the past few months. Last week, it fell below the neckline of this pattern to a multi-month low of 53,393. Bitcoin formed a small hammer pattern on Friday, explaining why it rebounded on Saturday. This bounce is most likely a dead cat bounce, which occurs when a down-trending asset bounces back in the short term. Bitcoin remains below its 50-day and 200-day exponential moving averages (EMAs) and the relative strength index (RSI) is below the neutral point of 50. Therefore, the path of least resistance is downwards and the next point to watch is 50,000. Are you ready to trade free daily Forex trading signals? We have handpicked the best MT4 cryptocurrency brokers in the industry.
MENAFN08072024000131011023ID1108416301
Legal Disclaimer:
MENAFN provides the information “as is” without warranty of any kind. We do not accept any responsibility or liability for the accuracy, content, images, videos, licenses, completeness, legality, or reliability of the information contained in this article. If you have any complaints or copyright issues related to this article, please contact the provider above.

