

Bitcoin price has risen above the $70,000 level. BTC is currently sustaining gains above support and is likely to see further gains in the near future.
- Bitcoin continued its rise above the $70,000 level.
- The price is trading above $69,000 and the 100 hourly simple moving average.
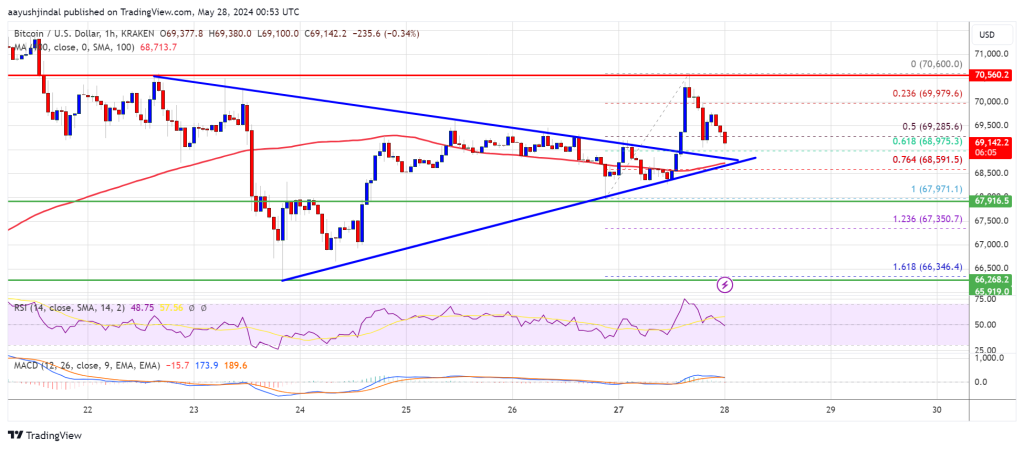
- On the hourly chart of the BTC/USD pair (data feed from Kraken), a major bearish trend line broke out above the resistance at $69,000.
- As long as the pair does not sink below the $68,500 support, it can begin to rise again.
Bitcoin price holds support
Bitcoin price has started to rise again from the support zone at $68,000. BTC has cleared the resistance at $69,000 and further moved into the positive zone. On the hourly chart of the BTC/USD pair, it has broken above the major bearish trend line with a resistance at $69,000.
The pair broke above the $70,000 resistance zone. The high was formed at $70,600 and the price recently turned down. There was a move below the $70,000 level. The price fell below the 50% Fib retracement level of the rise from the swing low of $67,971 to the high of $70,600.
However, the bulls are currently active near the same trendline as they are defending the 61.8% Fib retracement level of the rise from the swing low of $67,971 to the high of $70,600.
Bitcoin price is currently trading above $69,000 and the 100 hourly simple moving average. If there is a renewed upswing, the price may face resistance near $70,000. The first major resistance could be at $70,600. The next major resistance could be at $71,200.

A clear breakout above the $71,200 resistance could lead to a price surge. In the aforementioned case, the price could rise and test the $72,000 resistance. Further gains could send BTC towards the $73,200 resistance.
Will BTC fall again?
Bitcoin can continue to fall if it fails to rise above the $70,600 resistance zone, with the immediate support on the downside near the $69,000 level.
The first major support is at $68,500. The next support is currently forming near $68,000. Any further losses could send the price towards the $66,500 support zone in the short term.
Technical indicators:
Hourly MACD – The MACD is currently losing momentum in the bullish zone.
Hourly RSI (Relative Strength Index) – The RSI for BTC/USD is currently approaching the 50 level.
Key support levels – $69,000, followed by $68,500.
Key resistance levels – $70,000 and $70,600.